Recommend Cereals with the Correlation Coefficient
Doctor in Computer Sciences. Researcher Professor.
Today's post is about how to recommend things. Concretely, we are going to perform a basic implementation of an item-to-item recommender by using the Correlation coefficient we explored in another post.
To explore this idea, we will be using a Cereals dataset I downloaded from Kaggle. You can download the dataset from here.
The dataset contains about 77 different cereals with some interesting nutritional features such as calories, protein, fat, sodium, carbohydrates, sugars, vitamins, etc.
import numpy as np
import pandas as pd
import seaborn as sns

import matplotlib.pyplot as plt
Now, let's load the data and select only the nutritional attributes we want to use:
data = pd.read_csv('data/cereals-products.csv')
data = data[['name','calories','protein','fat','sodium', 'fiber', 'carbo', 'sugars', 'potass', 'vitamins']]
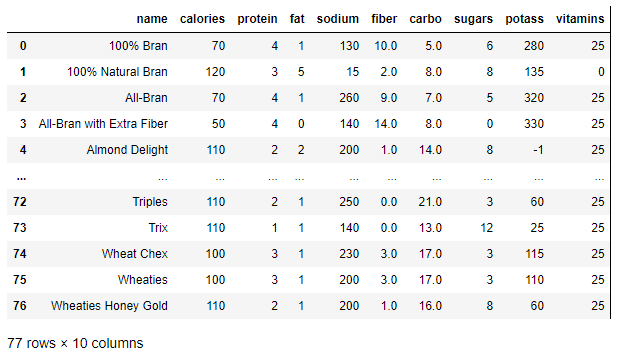
As you can see, there are 77 different kinds of cereal, each one described by 10 features. The objective is to calculate a metric that can tell us how "similar" is one cereal to the other. That metric is the Pearson Correlation Coefficient.
Numpy has the corcoeff method that allows us to calculate the correlation coefficient of all cereals at once! We will use the data loaded to estimate the correlation between cereals. This will generate a correlation matrix with dimensions [77,77].
To calculate the Pearson matrix, we just need the numerical attributes, so we will avoid putting the "name" column as this has no use, for now.
pearson_matrix = np.corrcoef(data[data.columns[1:]])
The pearson_matrix is a 77x77 matrix of the correlations between cereals. To visualize this, we will use the seaborn library with the following code.
plt.figure(figsize = (16,16))

sns.heatmap(pearson_matrix,
        xticklabels=data["name"],
        yticklabels=data["name"],
        fmt="d")
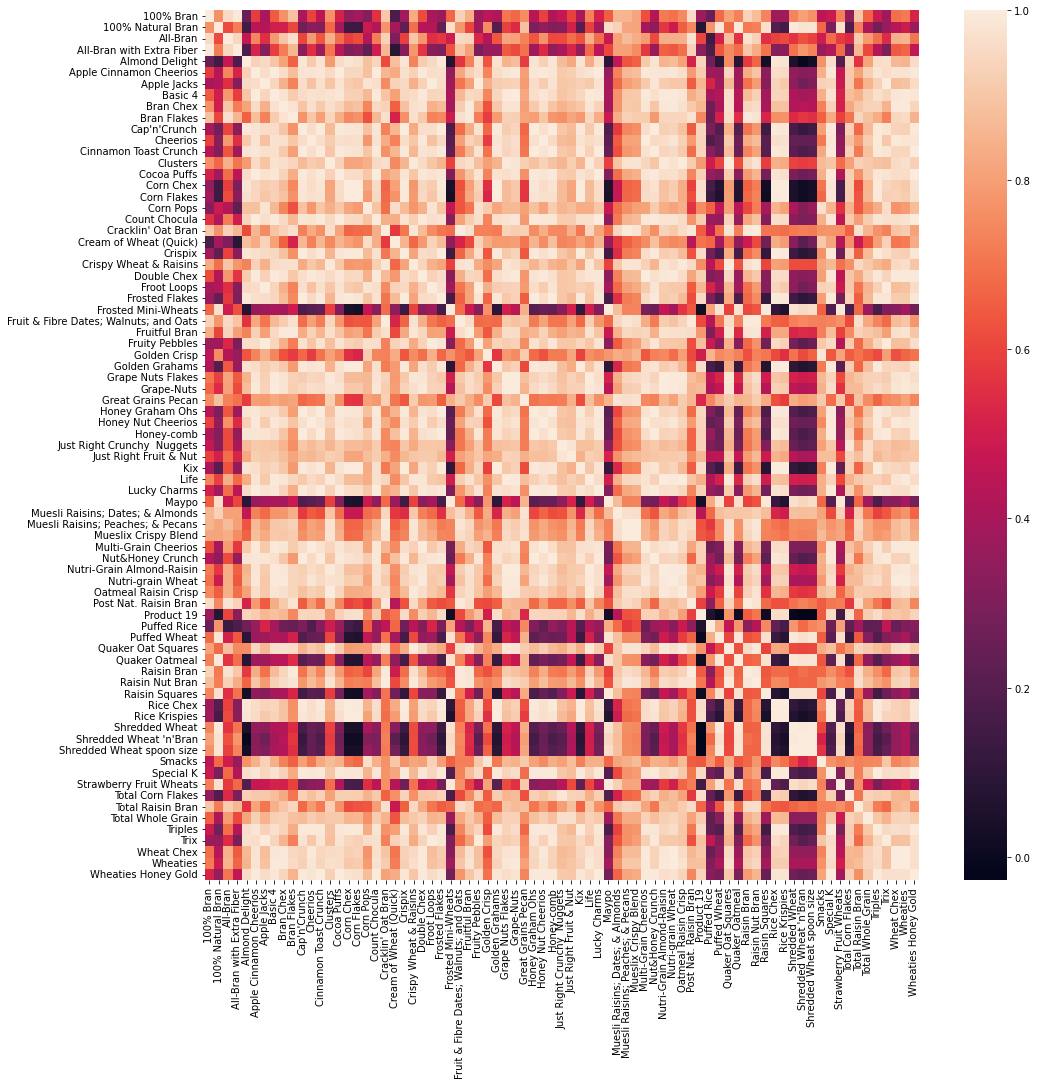
Let's remember that the correlation measures the level of the linear relationship between two lists. If the correlation is perfect, then it will be 1.
The pearson_matrix is all we need now to search for cereals that are similar. The idea is that if we choose "Special K", for example, we look into the pearson_matrix for those cereals that have the highest correlations. Is that simple! All we need to do now, is create a method "recommend" which will search in the pearson_matrix the top-k most similar cereals.
The code looks like this:
def recommend(cereal_name, top_k):
    cereal_names = data["name"]
    index = list(cereal_names).index(cereal_name)
    coeff = pearson_matrix[index]
    df = pd.DataFrame({'pearson':coeff, 'name' : cereal_names}).sort_values('pearson', ascending=False)
    return df.head(top_k)
This method returns the list of cereals names sorted by their respective pearson coefficient.
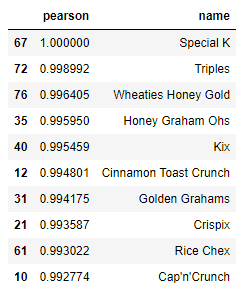
Let's search for "Special K" to get the top 10 most similar cereals:
recommend("Special K", 10)
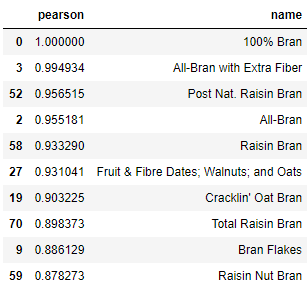
What about "100% Bran"
recommend("100% Bran", 10)
Final Thoughts:
- The correlation coefficient is used as a similarity measure to find other products that are mathematically similar, based on the data attributes.
- If this recommender is used in a commercial setting, it should be used as tool to find replacement cereals or similar cereals in terms of nutritional values, not flavor.
- The person matrix calculated here should be persisted somewhere so that this is not estimated on every call. If new products are added, the matrix should be generated again.
- This technique shown here works also with other types of data such as categorical data or text. In the case of categorical data, variables should be one-hot encoded. If used with text, then the text should be converted into tokens.