Covariance and Correlation Coefficient

Doctor in Computer Sciences. Researcher Professor.
Covariance
Covariance is a measure that help us understand if two independent variables vary together (also called joint variability). If the covariance is positive the the variables move in the same direction. If the covariance is negative, then they move in inverse direction. Let's check the formula first and then we will create an example to build the intuition.
Formula
$$cov(X,Y) = \frac{\sum(X_i - \overline{X})(Y_i - \overline{Y})}{n}$$
where:
- \(X_i\) represent each value of the X array
- \(\overline{X}\) is the mean of the X array
- \(Y_i\) represent each value of the Y array
- \(\overline{Y}\) is the mean of the Y array
Interpretation
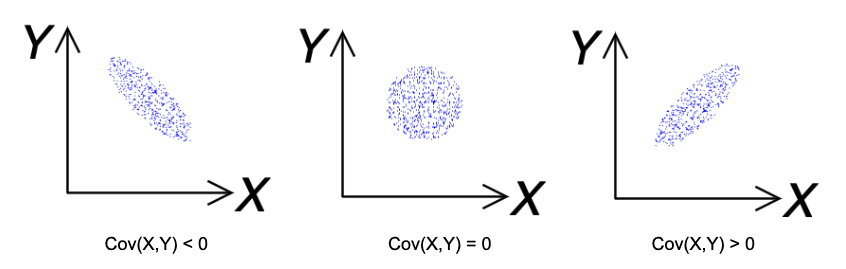
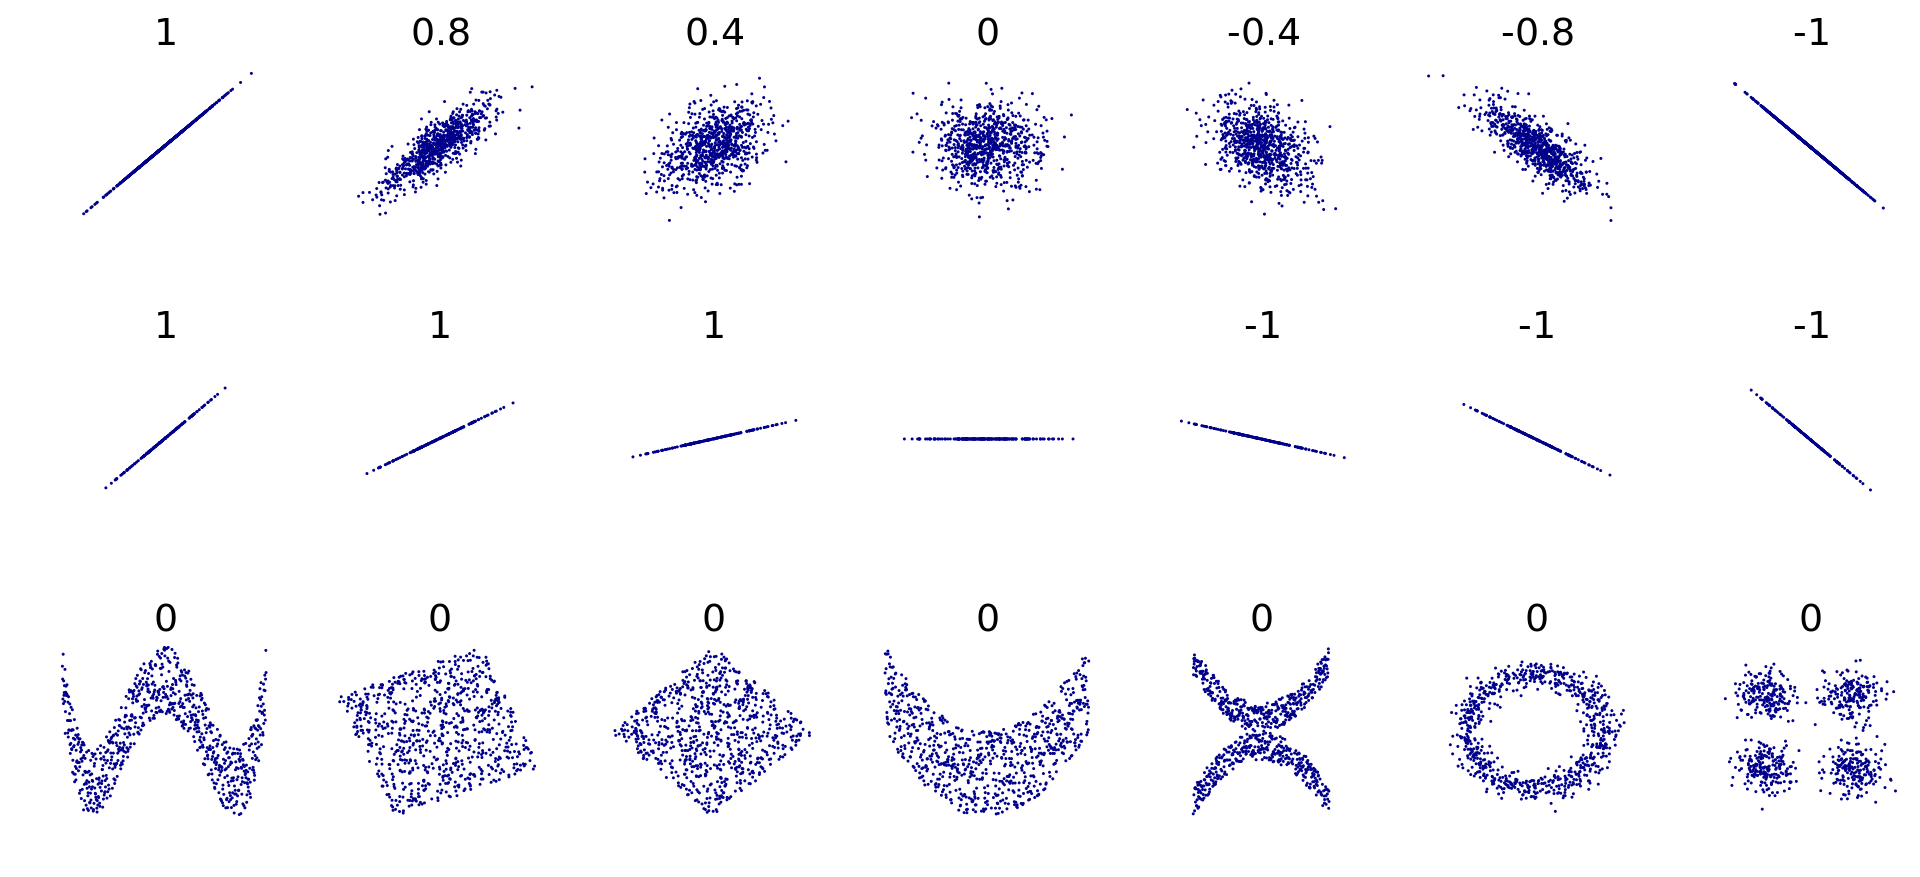
This is a powerful image, as it demonstrates what covariance is telling us about the relationship. In case the relationship is nearly-linear and is its direction is pointing down (negative slope) then the covariance is negative, otherwise is positive. But look at the center case where the shape is like a circle. Because covariance does not understand non-linear relationships, anything that looks like this will have a value close to zero.
For now, covariance can be used as a formula that tells us about the direction of the relationship, but now how strong the relationship is. For these matters we will use the Correlation Coefficient which includes covariance as part of its formula. Let's check it out.
Correlation Coeficient
The correlation coefficient also (Pearson Correlation Coefficient or PCC) measures the strength of a linear correlation between two variables. Pearson's correlation coefficient is the covariance of the two variables divided by the product of their standard deviations.
The standard deviation is a measure of the dispersion of data from its average. Covariance is a measure of how two variables change together. However, its magnitude is unbounded, so it is difficult to interpret. The normalized version of the statistic is calculated by dividing covariance by the product of the two standard deviations.
The correlation coefficient is normalized in the range of [-1, 1]
Formula
$$\rho(X,Y)=\frac{cov(X,Y)}{\sigma_X\sigma_Y}$$
As we can observe, we are normalizing the Covariance by the product of the standard deviations from the two variables.
Interpretation
Higher values of 1 variable tend to be associated with either higher (positive correlation) or lower (negative correlation) values of the other variable, and vice versa (Schober et al, 2018).
Example with Python and Numpy
Thankfully we don't need to worry about implementing these formulas, the numpy library already has this implemented in a very efficient way. Lets us it with an example.
Create a Fake Dataset using Sklearn datasets.make_regression
import numpy as np
from matplotlib import pyplot as plt
from matplotlib.pyplot import figure
from sklearn import datasets

n_samples = 1000
n_outliers = 10

X, y, coef = datasets.make_regression(
    n_samples=n_samples,
    n_features=1,
    n_informative=1,
    noise=10,
    coef=True,
    random_state=0,
)
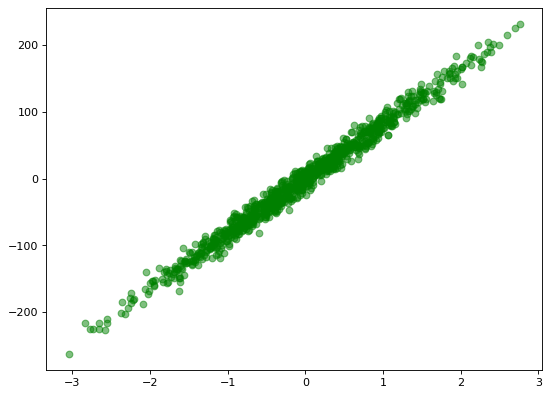
Let's plot the data
figure(figsize=(8, 6), dpi=80)
plt.scatter(X,y, color="green", alpha=0.5)
Calculate Covariance with Numpy Cov
np.cov(X.reshape(-1),y)[0,1]
Covariance = 80.0952750884216 This does tells us about the positive relationship, but that 80 is not telling us much. Thats why we need to use the Correlation Coefficient to have a normalized value between [-1, 1] of the strength of the relationship.
Calculate the Correlation Coefficient with Numpy Corrcoef
np.corrcoef(X.reshape(-1),y)[0,1]
Correlation Coefficient = 0.9925933634659728. Well this tell us is very linear and also very strong correlation!
How can we use this?
We can build an item-to-item recommender system. If products are described as arrays of numerical values, we can use the Pearson correlation coefficient as an element to compare items that are correlated to each other, so that we can find the top k items that are similar to something of interest.
If an Xbox is X1 and Playsation is X2 and a Paper Towels is X3, we can calculate the corrcoef(X1,X2) and corrcoef(X1,X3) to find out the best correlation is probably between X1 and X2, so that if you select X1 in your shopping cart, then we can recommend you X2 because it has a higher correlation with X1 rather than with X3.
References
Schober, Patrick MD, PhD, MMedStat; Boer, Christa PhD, MSc; Schwarte, Lothar A. MD, PhD, MBA Correlation Coefficients: Appropriate Use and Interpretation, Anesthesia & Analgesia: May 2018 - Volume 126 - Issue 5 - p 1763-1768 doi: 10.1213/ANE.0000000000002864