P-Value Intuition: Flipping Two Coins Example

Doctor in Computer Sciences. Researcher Professor.
To understand what a p-value is, I looked into some simple scenarios to explain this without having to get into probability density functions and distributions. StatQuest had a very nice idea of explaining this with coin flips. Let's check this out here.
Probability of Tossing two Coins
First, we will flip two coins two times to explain the probability of getting something out of these scenarios. The following image explains all possible outcomes.
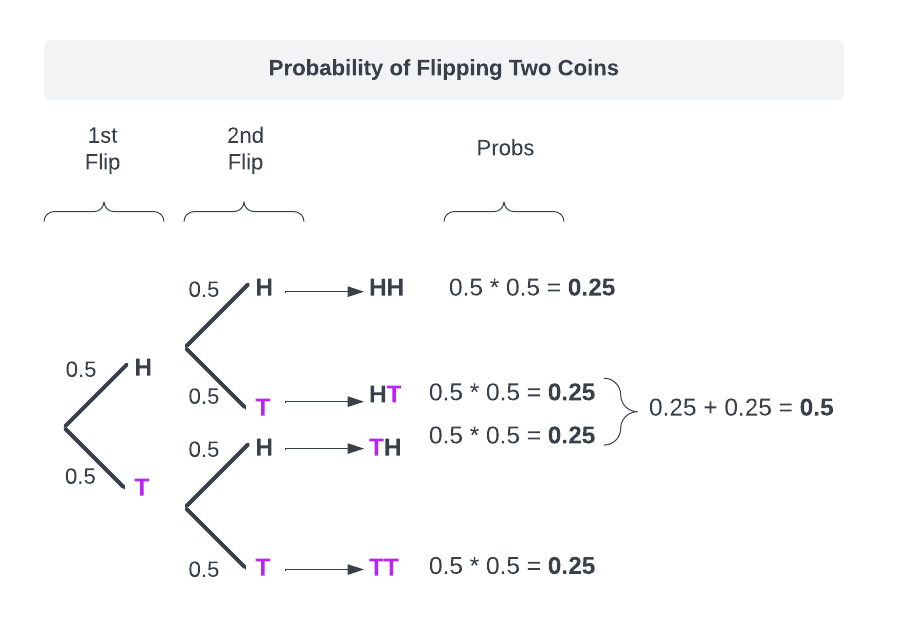
As you can observe from the diagram we can get HH, TT, or [HT-TH] which are basically the same thing. We calculate the probability of these 3 outcomes, assuming each toss is independent. So the probability of getting a HH or TT is 0.25, but the probability of getting either HT or TH is 0.5.
What is the p-value?
The p-value is not the coin flip probability. We have already calculated that.
The p-value is the probability that random chance has generated the data, something of equal chance or rarer. With p-values, we look to understand the probability of how the data was generated.
What is the p-value for HH?
The p-value is the sum of the probability of HH (which we already know is 0.25) + the probability of something of equal chance (in this case the probability of TT which is also 0.25) + the probability of a rarer event (which in this case is 0 because there is nothing rarer than what we have in the diagram)
p−value(HH)=p(HH)+p(TT)+0 p−value(HH)=0.25+0.25+0=0.5
So to recap, the probability of HH is 0.25 but the p-value of HH is 0.5.
So?
Well, the p-value checks the probability that HH is generated by luck. The 0.5 means that HH is not special, it's a very common combination that is very plausible caused by luck. When a p-value is less than 0.05, we say that it is statistically significant, because it rejects the null hypothesis, which is that the observed event (in this case HH) was caused by luck or any other factor.
p-values in regression or ML models
We can use p-values in machine learning models to understand the significance of predictors (variables) used for regression or classification. For example, we might use scipy to generate a regression model with OLS for some problems such as estimating the battery life of a Tesla car after x mileage. The OLS will make the linear regression model and calculate the p-values for each variable including the intercept.
When we observe a predictor if a p-value is lower than 0.05, we say that that variable is significant because the change in that predictor affects the response variable (y) not by luck. Then that p-value rejects the null hypothesis.
Warning: We have to be careful with the curse of dimensionality and p-values. If our ML model has too many variables, this might cause the predictors to have a very low p-value making them significant when they are not. Reducing the number of dimensions and pruning the model from variables that make noise is a must when using p-values.
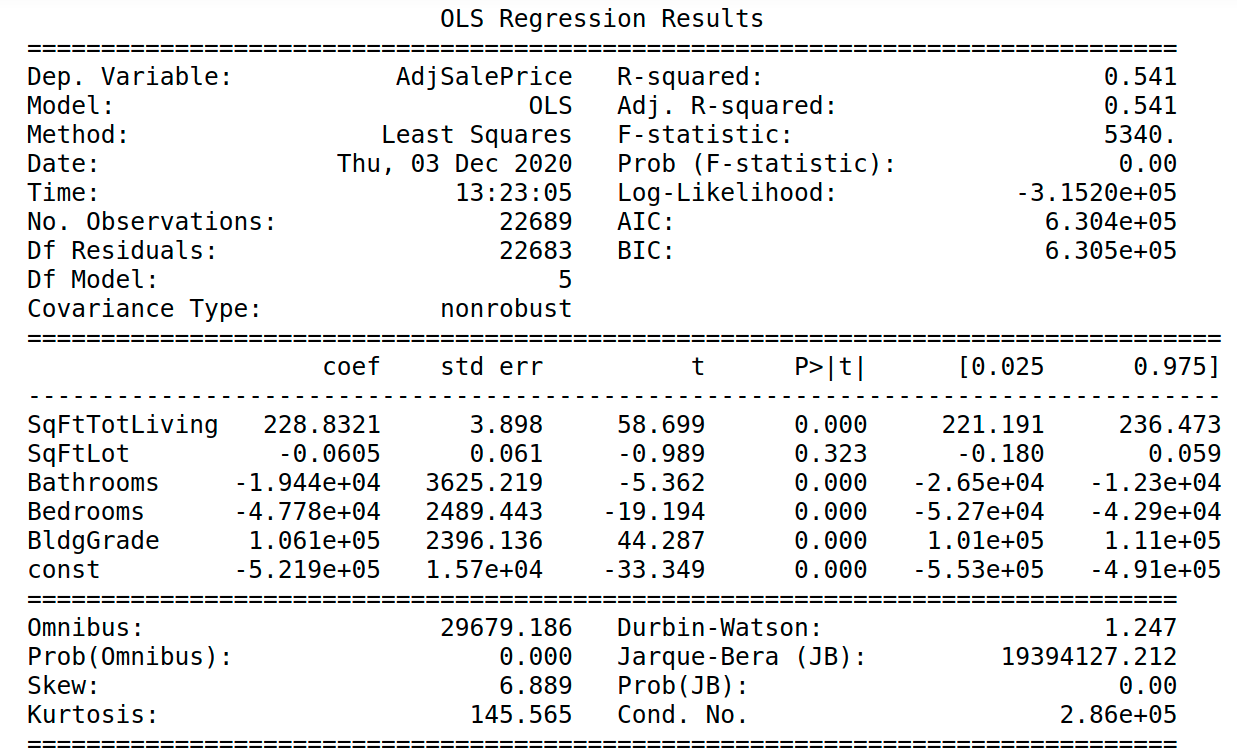
The following image shows an example print of the scipy OLS. You can see that every regressor has its p-values (p>|t|) calculated and (almost) all of them are less than 0.05, which means they are statistically significant. Since SqFtLot has a 0.323 > 0.05, we can think of removing this feature since its variability does not go along y.