


Lucky Correlations
One of the challenges we face while designing machine learning solutions is picking the right prediction features. Deciding which elements are essential and which ones genuinely contribute to model performance becomes complicated as the number of features increases.
The infinite monkey theorem states that a monkey hitting keys at random on a typewriter keyboard for an infinite amount of time will almost surely type any given text, such as the complete works of William Shakespeare.

As absurd as the theorem sounds (which has been proved btw), has an important implication in machine learning. When there are too many features, there is the probability that the model can predict the response variable by pure luck, just like the monkey typing random stuff, because some variables result in being perfect predictors.
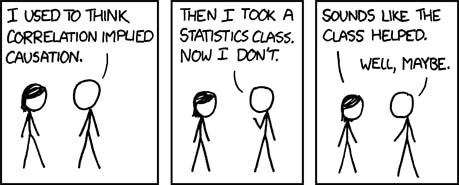
In statistics, a spurious correlation (or spuriousness) refers to a connection between two variables that appears to be causal but is not. With spurious correlation, any observed dependencies between variables are merely due to chance or related to some unseen confounder (Kenton, 2021).
Spuriousness then implicates the existence of variables in machine learning models that might be nearly-perfect predictors but by pure luck. To understand better the predictive capabilities of spurious relationships, let's look at the following example from Tyler Vigen:

Let's seriously consider the relationship from the chart above. If this is true, the US government should reduce the spending on science and technology to reduce the suicide rate. But that relationship is casual; it is just a coincidence. And this phenomenon can also happen within your machine learning model. There might be variables that perfectly predict the response (y) but by luck. This situation can also appear unnoticed as the dimensional space increases.
Covariance & Spurious Correlations
Covariance is a measure of the joint variability of two random variables. This is, the changes in the X variable are aligned to changes in the Y variable. The issue with covariance is that the relationship is judged based on the linear relationship (as in the Pearson Correlation Coefficient). Two random variables might be perfectly correlated but with a non-linear relationship. This can happen in neural networks when an image classifier learns to identify a "moose" from images because it realizes that the moose images are always in snowy conditions. The classifier learns about the snow and forgets the moose. And because the dataset images with snow are the only ones with a moose, then the classifier predicts the moose perfectly every time, making us think that the classifier is doing a great job.

If you want to know how to influence neural networks to perform the wrong predictions, please read:
- Unsupervised Adversarial Defense through Tandem Deep Image Priors (researchgate.net/publication/347798137_Unsu..)
- A Baseline for Detecting Misclassified and Out-of-Distribution Examples in Neural Networks (arxiv.org/pdf/1610.02136.pdf)
- Adversarial Examples in the Physical World (taylorfrancis.com/chapters/edit/10.1201/978..)
What can I do?
- First, today's machine learning solutions are based on correlations, not causations. Many solutions work because of the correlations learned, even if they are full of nonsense. Keep this in mind.
- Looking for the best features is an art more than science. When the model has way too many elements, they seem to contribute to the model's accuracy in the same way. Check for the curse of dimensionality.
- Focus on data first. Make sure you collect good data (moose pictures in many shapes, angles, and seasons) and use cross-validation to validate the model performance. Good data is the critical ingredient for a good model.
- Split the data into train/valid/test sets. The train set is used to make the model learn. The valid set is used to validate the model accuracy with cross validation. The test set is a randomly picked sample before the train and valid set were created. This set is important as it represents real-world data the model has never seen before.
- Using the covariance matrix only helps spot linear relationships. Don't take this for granted.
- Test manually. Collect images or new samples and use them to validate the model. Spurious relationships usually overfit the model. This means that if the classifier is making lucky predictions, it should not work with other external images.
- Always start with a simple architecture and data model. The simpler it is, the easiest to spot the issues in the classifier. Neural networks that are too tall and wide are difficult to debug.
- Don't hack the data to make the classifier work. A penguin detector based on penguin images from cartoon books might be convenient because of the reduced amount of colors. Still, it will certainly not generalize to authentic penguin images from the wild.
- Test several algorithms. There might be a chance that a machine learning algorithm might overfit the data giving us the sensation that the classifier can learn beyond the training set. For example, don't just use decision trees; test random forests and compare the results.